After nearly two months, LCX [LCX] has finally shown a bullish trend on the 1-day chart. Over the period from June to October, the token faced a significant downtrend, losing around 70% of its value. However, recently, LCX has managed to bounce back, recording a 163% gain over the past week.
Currently, LCX has surged by 43% in the last 24 hours, surpassing the $0.24 mark, which was previously considered a resistance level. The big question now is how far can LCX’s upward movement go?
Significance of the $0.2-$0.25 Range for LCX
Back in March, the price range between $0.223 and $0.232 acted as a strong demand area for LCX. Following a rally to $0.4 in the final week of March, a pullback occurred, leading to a downtrend after the $0.32 level turned into a resistance zone.
Currently, LCX is trading at $0.2695, with recent highs reaching $0.2778. The token breached the $0.223 resistance level with relative ease, showing strength. Notably, trading volume has significantly increased from $4.43 million on November 21 to $35.9 million on November 25, reflecting strong market activity
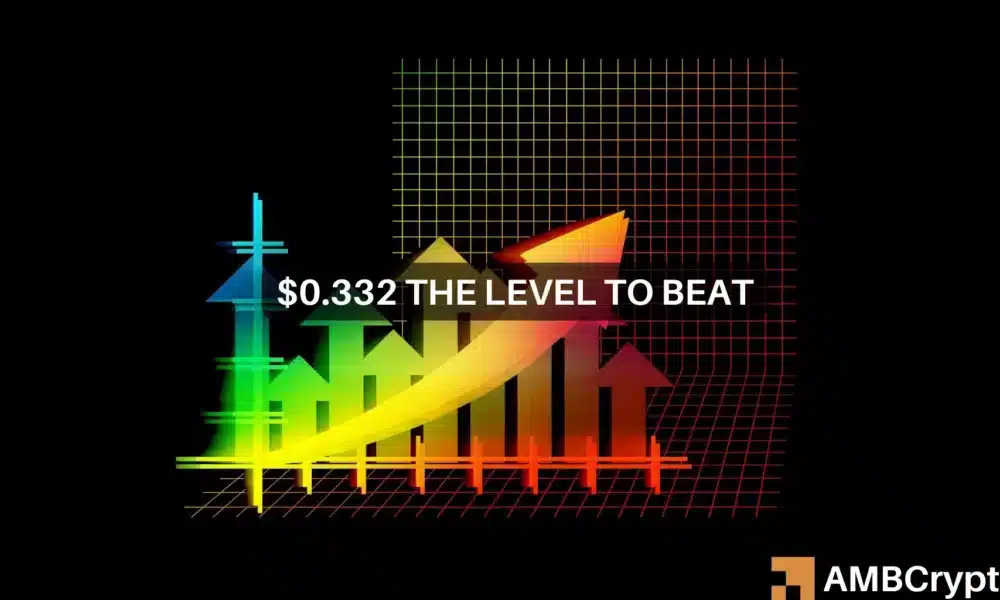
To address the bearish long-term trend despite the recent bullish movement, Fibonacci retracement levels were utilized. To signal a sustainable uptrend, LCX needs to surpass the $0.332 mark convincingly.
Observing the indicators, the CMF indicates substantial capital inflow with a reading of +0.1, while the Directional Movement Index shows a robust uptrend with the +DI (green) and ADX (yellow) above 20.
Disclaimer: The content of this article is based on personal opinion and does not constitute financial or investment advice.